Case study · Client work · Public health
HRSA data dashboard
The national dashboard that 84 free and charitable clinics used to report their COVID-19 vaccination and education work.
- 84 of 84clinics met requirements
- 16states
- $7.3Mprogram
Asked2021
Start with a map of where rides go.
The first idea: map where rides go to show program coverage.
Turned2021
Show context in aggregate, not patient by patient.
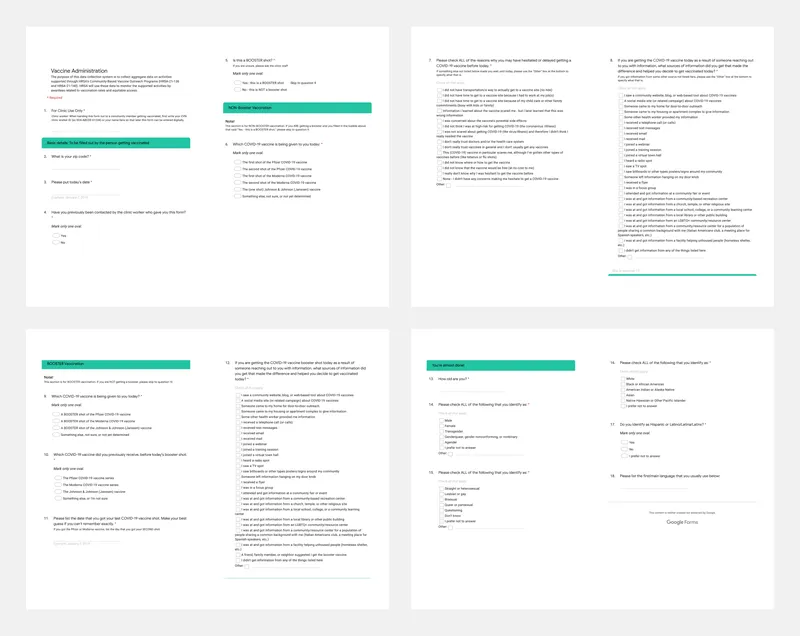
Layer patient and clinic context onto usage, and show it in aggregate rather than patient by patient.
Made2021 to 2022
One dashboard, by clinic and by state.
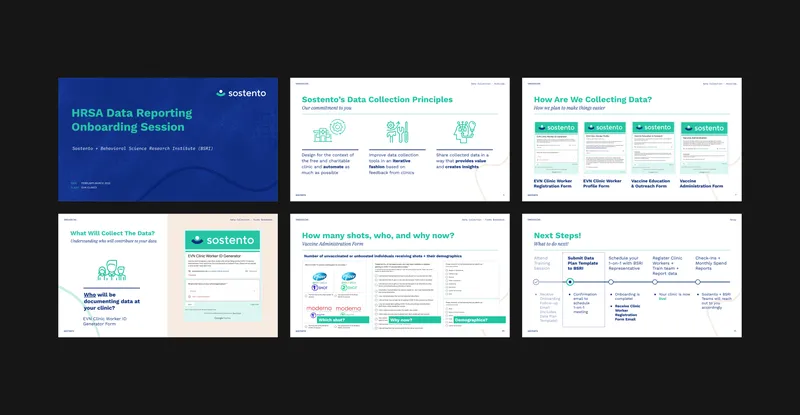
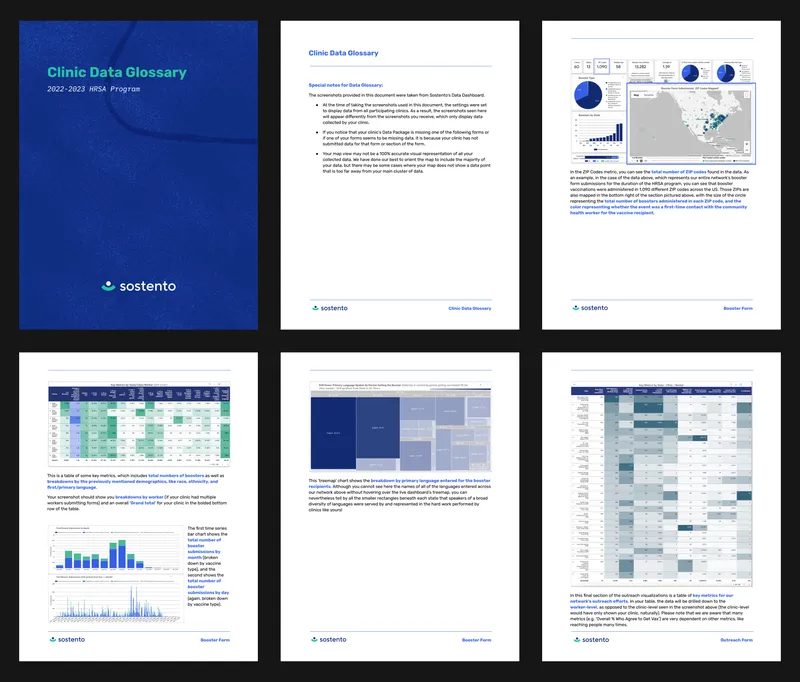
Designed and shipped a national data collection dashboard, viewed by clinic and by state.
Landed2022
Every clinic met its reporting requirements.
All 84 clinics in 16 states met their reporting requirements. The work grew into Rides for Health Equity.
Details
- My role
- Designed and shipped the national data collection dashboard.
- Team
- Kristyne Hong, Rose Pagano, Amberly Solorzano, Ritika Chanda, Amelia White, with the Behavioral Science Research Institute (BSRI)
- Proof
- 84 clinics in 16 states; $7.3M program; all 84 met requirements. COVID-19 vaccination and education data.
- Where it landed
- Shipped.
- More numbers
- 84 clinics
Grew into Rides for Health Equity.
More exhibits3 · show all
ThreadsPublic systemsLegible dataAccess
Related
- Client work Collier Township civic platformClient work · Public systems, Access
- Client work Financial Intelligence System (US Senate)Client work · Public systems, Legible data
- Academic Context SwitchingAcademic · Legible data